App: stocks.vlg.engineer
Source code: FastAPI Backend | Vue.js Frontend
0) The app
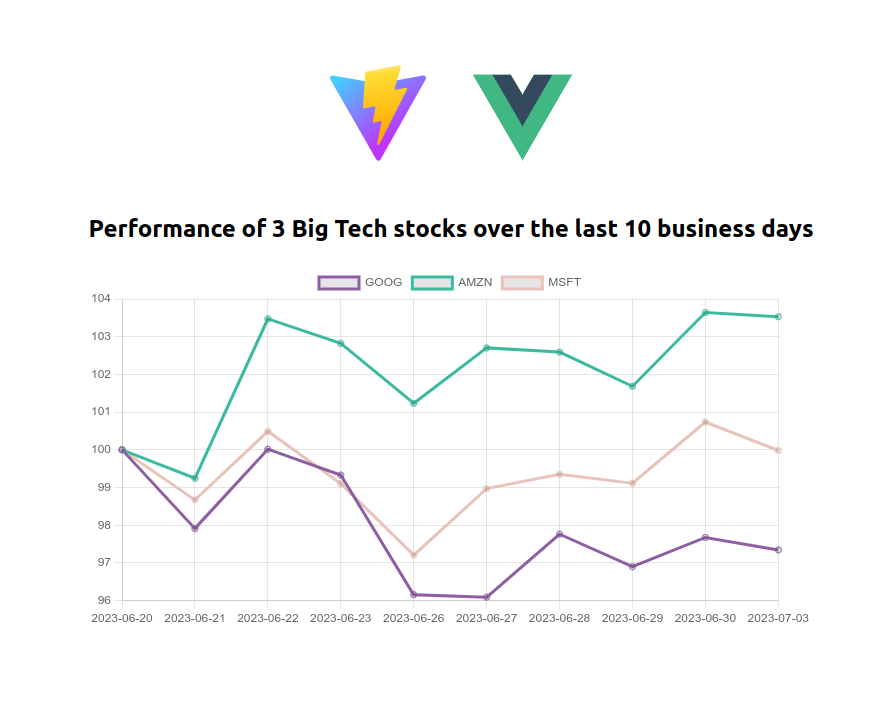
This application shows the performance of 3 stocks (Google, Amazon and Microsoft) over the last 10 business days. The 3 stocks are normalized to an initial value of 100 for easier comparison.
The app is made of 2 components:
- Python Backend: fetches data from a stock API, processes it and properly formats it for plotting
- Javascript Frontend: requests data from backend and builds the live chart
1) Backend
The main part of the backend is the FastAPI application (backend_fastapi.py). It has a single endpoint, /data, that returns the stock data for the last 10 business days:
|
|
stocks is an instance of the data class Stocks. This class encapsulates the logic for fetching and processing the stocks data.
The Stocks class is intentionally instantiated in the endpoint, because this provides evolvability. If in the future we decide to let the user set the window (number of business days) parameter by himself, we can easily change the endpoint to @app.get('/data/{window}') and fetch the corresponding data from there.
@dataclass
Some fields of the data class Stocks depend on other fields, and should not be specified at instantiation:
|
|
The field Stocks.days is the actual list of string dates (e.g. ["2023-06-02", "2023-06-03"]) of the last Stocks.window days. The user only specifies the int attribute Stocks.window, then the class should automatically figure what Stocks.days is. For these kinds of attributes, we tell Python not to expect these parameters at instantiation and to set them post-instantiation:
|
|
Error handling and logging
Since the backend will be deployed on a remote machine, errors are both catched and logged to be properly tracked.
Below is a HTTP request fetching the closing price for a given ticker/day:
|
|
Explanation: before raising the error, we catch it (except) to log it, then it is raised again.
Asynchronous HTTP requests
To get the closing price, the stocks API called by this app requires 1 HTTP request per given ticker/day. The order of magnitude for 1 HTTP GET request is 1 second. If the HTTP requests were made sequentially, the user would have to wait about 30 seconds (3 tickers * 10 days * 1 second) for the chart to appear upon opening the application.
For this reason, the data is fetched asynchronously using Python’s built-in asyncio, and httpx async client. See utils.py for the full implementation.
Business trading days
In order to get the list of actual US trading days, pandas implements bdate_range() and pandas.tseries.holiday.USFederalHolidayCalendar.
2) Frontend
The frontend is implemented in Vue.js (version 3, Composition API) and built with Vite.
Its sole component is the chart, that leverages the Chart.js library.
Async
Before displaying the chart, the frontend requests data from the backend:
|
|
But the rest of the application is loaded before the completion of the above HTTP request (the Vite and Vue.js logos can be seen while waiting for the chart to appear). This is done with Vue’s Suspense feature:
|
|
3) Deployment
Docker
First of all, the backend is containerized.
Repo:
/stocks_backend
├── workdir
│   ├── backend_fastapi.py
│   ├── utils.py
│   ├── requirements.txt
├── Dockerfile
Dockerfile:
|
|
Google Cloud Run
The container is deployed on GCP’s Cloud Run service:
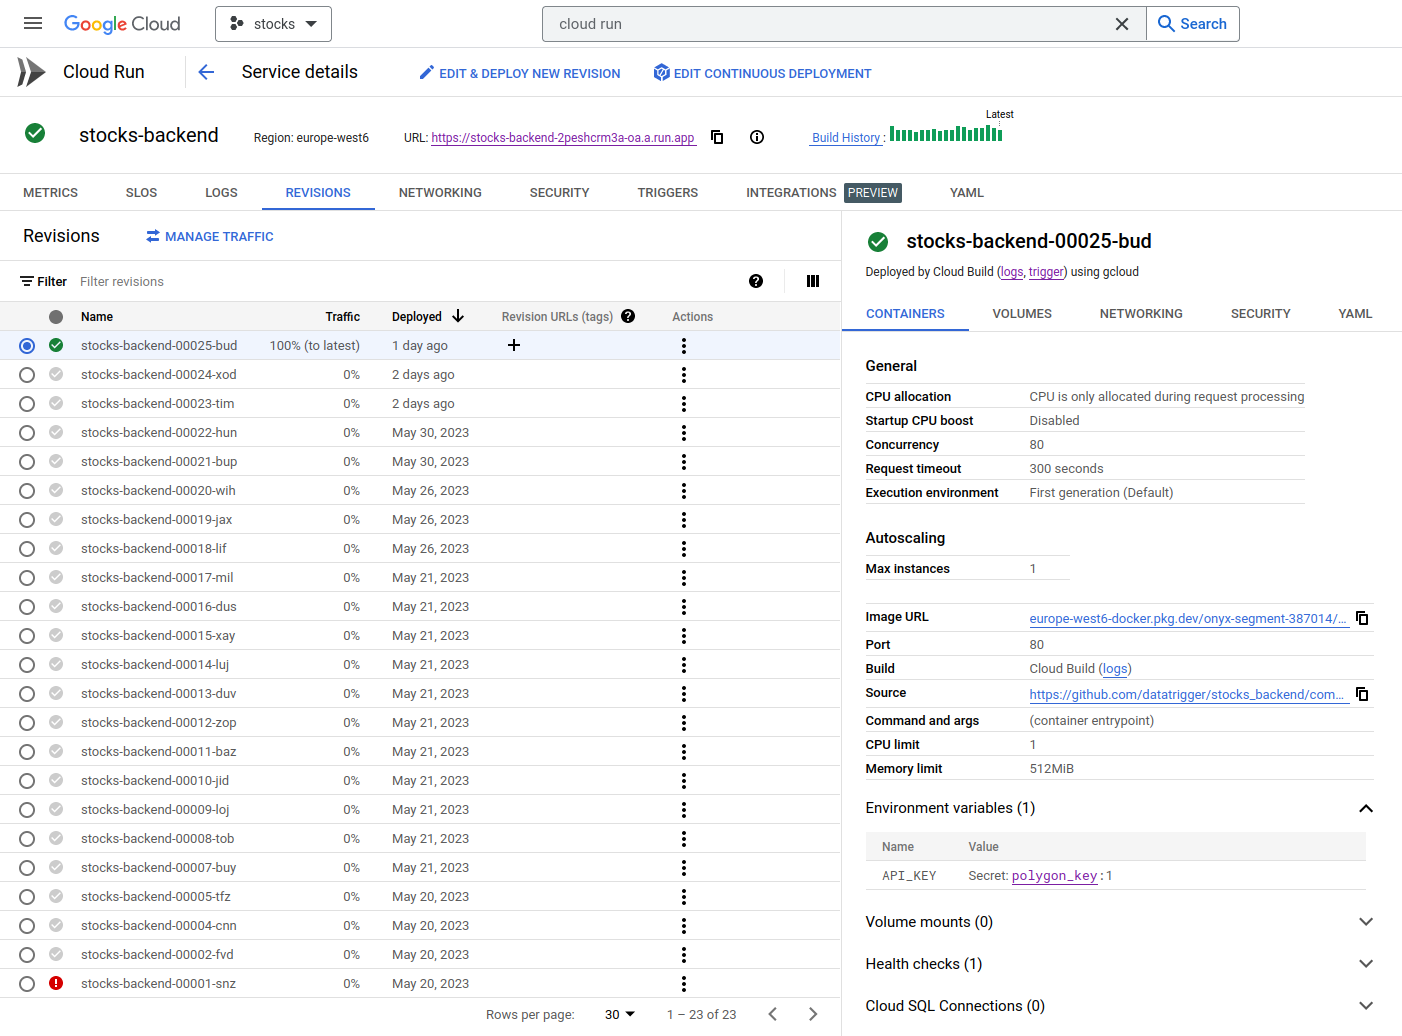
Security
The API key is stored in Google Secret Manager, fetched by Cloud Run and injected in the Docker container as an environment variable
|
|
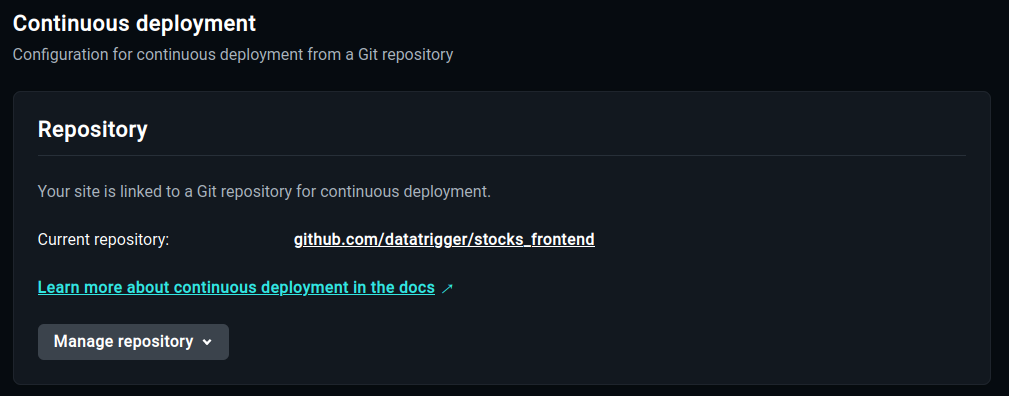
Continuous Deployment
Cloud Run builds/deploys the container directly from the backend source repository. Each push on the repo automatically triggers a new build in Cloud Run.
Autoscaling
Cloud Run automatically scales the number of containers depending on the traffic. Min and max number of container instances are specified by the user:
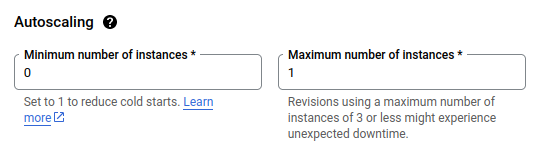
These parameters are very useful to manage costs without diving into load balancer implementations and such.
Setting the min number of instances to 0 or to n > 0 has important consequences:
If the number of running instances is allowed to be 0, then the costs can be greatly reduced, especially if the app does not run a lot (for example, a demo app like in this post). On the other hand, cold starts (from 0 instance to 1 instance) significantly increase response time.
Netlify (Frontend)
Netlify is a free platform, it is great to serve static content. Features include free and automatically renewed TLS certificates (HTTPS) or continuous deployment:
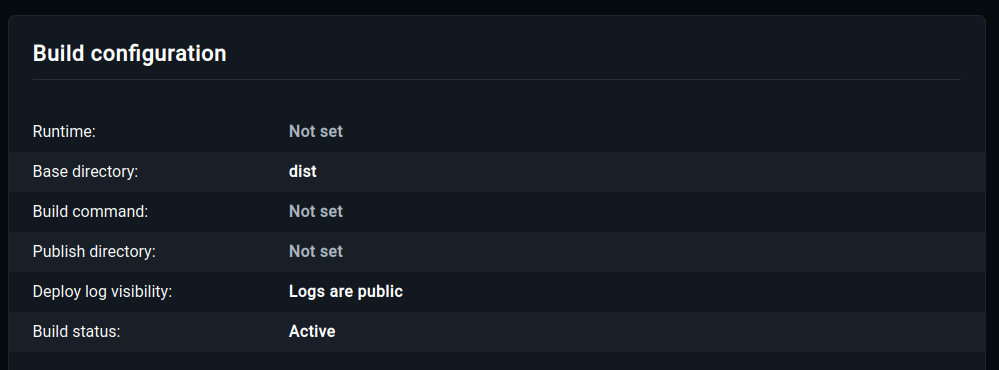
The frontend of the stocks application is built with Vite in a folder named dist. This information is easily provided to Netlify for the automatic deployment:
This blog is also deployed on Netlify
4) Cool features that were not implemented
- Let the user choose the historical window and the tickers
- Compute metrics in the backend and display them in the frontend, in a table component:
- Cumulative Return: $R_c = \frac{P_{end} - P_{start}}{P_{start}}$
- Annualized return: $R_a = (1 + R_c)^{\frac{365}{n}} - 1$, $n$ is the length of window in days
- Annualized Volatility: $\sqrt{261} \thinspace \sigma_r$, with $\sigma_r$ the standard deviation of the daily returns
- Show live data updated without the user refreshing the page, with Javascript’s
setInterval()(but the Polygon API subscription for live data is very expensive) - Implement unit tests and integrations tests
- Use Google Cloud Functions or AWS Lambda to store historical data on a remote service (e.g. bucket, cloud database) and update it on a daily basis
- Avoid re-fetching historical data at every update
- Likely to decrease loading time
Thanks for reading!