The plots below are built using R’s ggplot2. The code is available on my Github
Problem formulation
Let $X$ and $Y$ be two independent random variables. Let us assume that their sum is big, i.e larger than a given number $a$ (or equivalently, their mean): $X + Y \geq a$. Under this assumption, is only one of them likely to be very large, or both moderately large ?
Gauss’s answer
If the pair $(X, Y)$ is normally distributed, then both $X$ and $Y$ are likely to be large at the same time. In order to understand why, let us look at the contour lines of the $(X,Y)$ pair’s density. For each point belonging to a given contour line, the density of the pair $(X,Y)$ is equal to a constant $C \in \mathbb{R}$. In this case, assuming $X, Y \sim \mathcal{N}(0,1)$, then the multivariate density is: $$f(x) := \frac{1}{2 \pi} e^{-\frac{x² + y²}{2}}$$ Hence, for a given constant $0 < C \leq \frac{1}{2 \pi}$: $$f(x) = C \Leftrightarrow x² + y² = -2 \log (2 \pi C) := C’$$ This equation shows that the contour lines of a two-dimensional normal distribution are circles. Here is the contour plot:
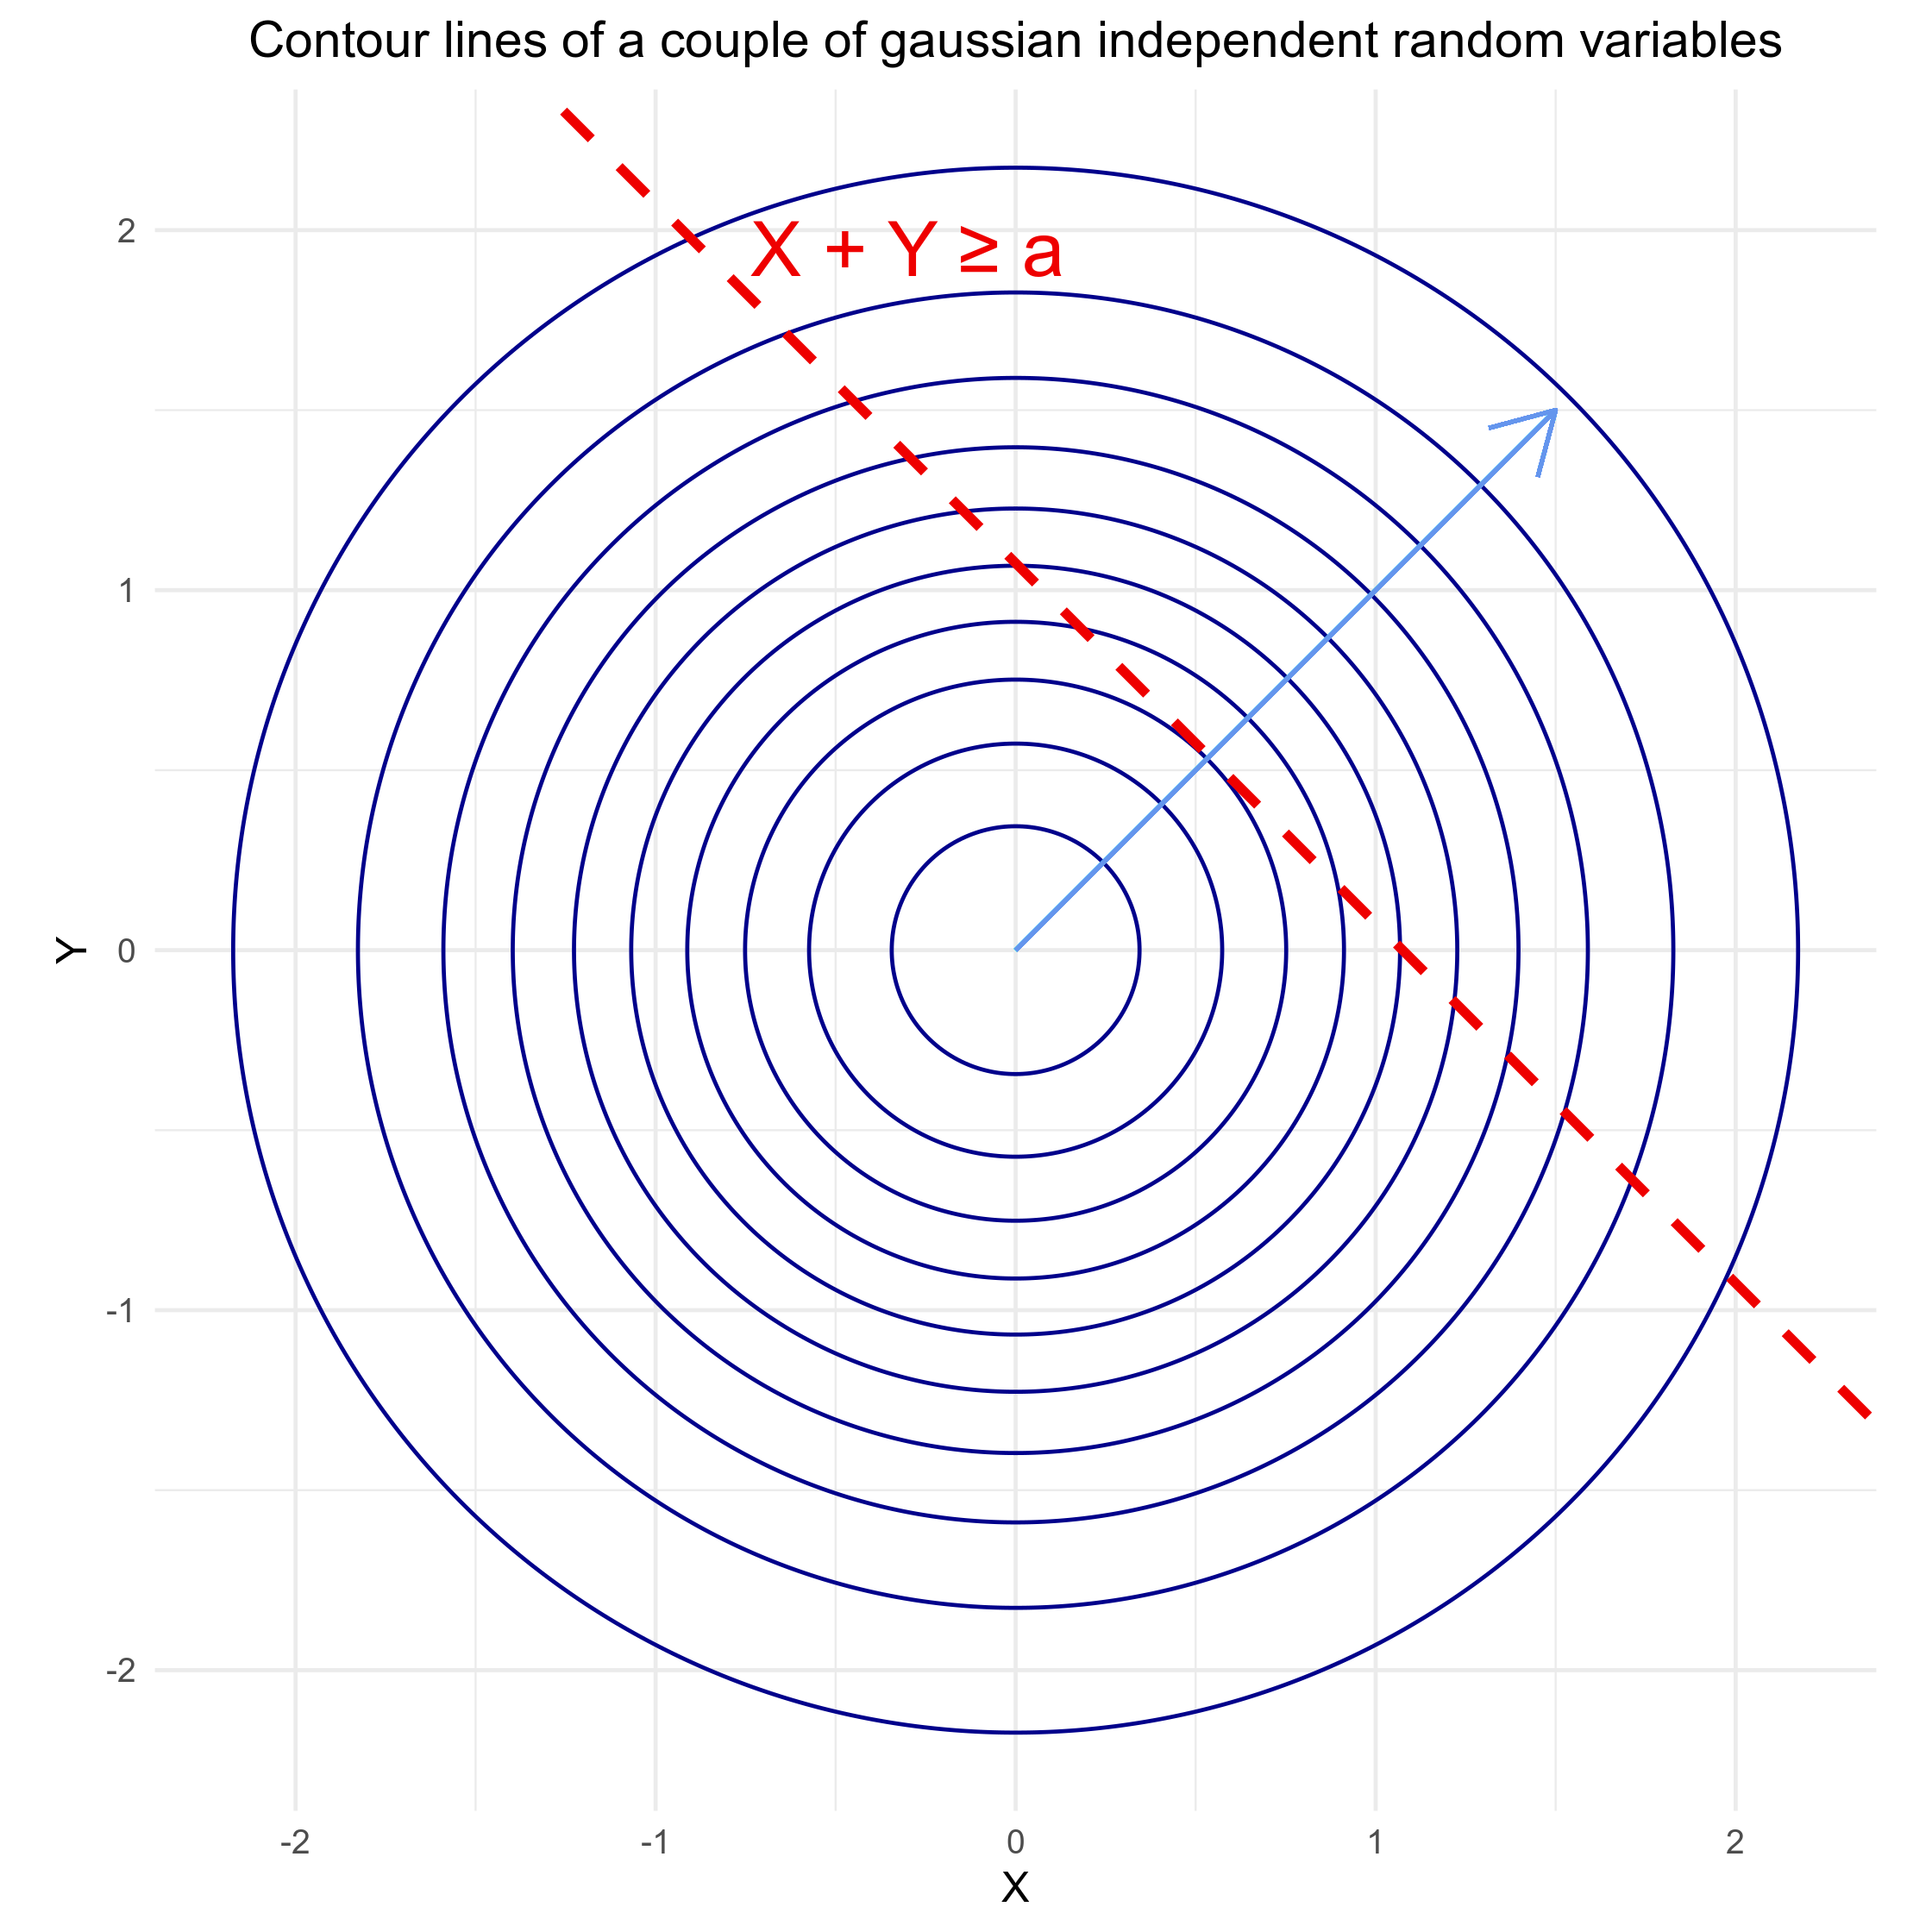
We can see that the point belonging to the domain $ \{ x + y \geq a \ | \ (x, y) \in \mathbb{R} \} $ with the highest density is on the line represented by the equation $y = x$. In other words, if
$X + Y$ is large, then most likely both $X$ and $Y$ are large.
Cauchy’s answer

If the pair $(X, Y)$ is Cauchy-distributed, then having either $X$ large or $Y$ large is more likely than having both $X$ and $Y$ large. Suppose that $X, Y \sim \mathcal{C}(0,1)$ (“standard” Cauchy distribution with location 0 and scale 1, obtained by dividing two gaussain independent variables). Then the multivariate density is: $$g(x):= \frac{1}{\pi²} \frac{1}{(1+x²)(1+y²)}$$ Below are the corresponding contour lines:
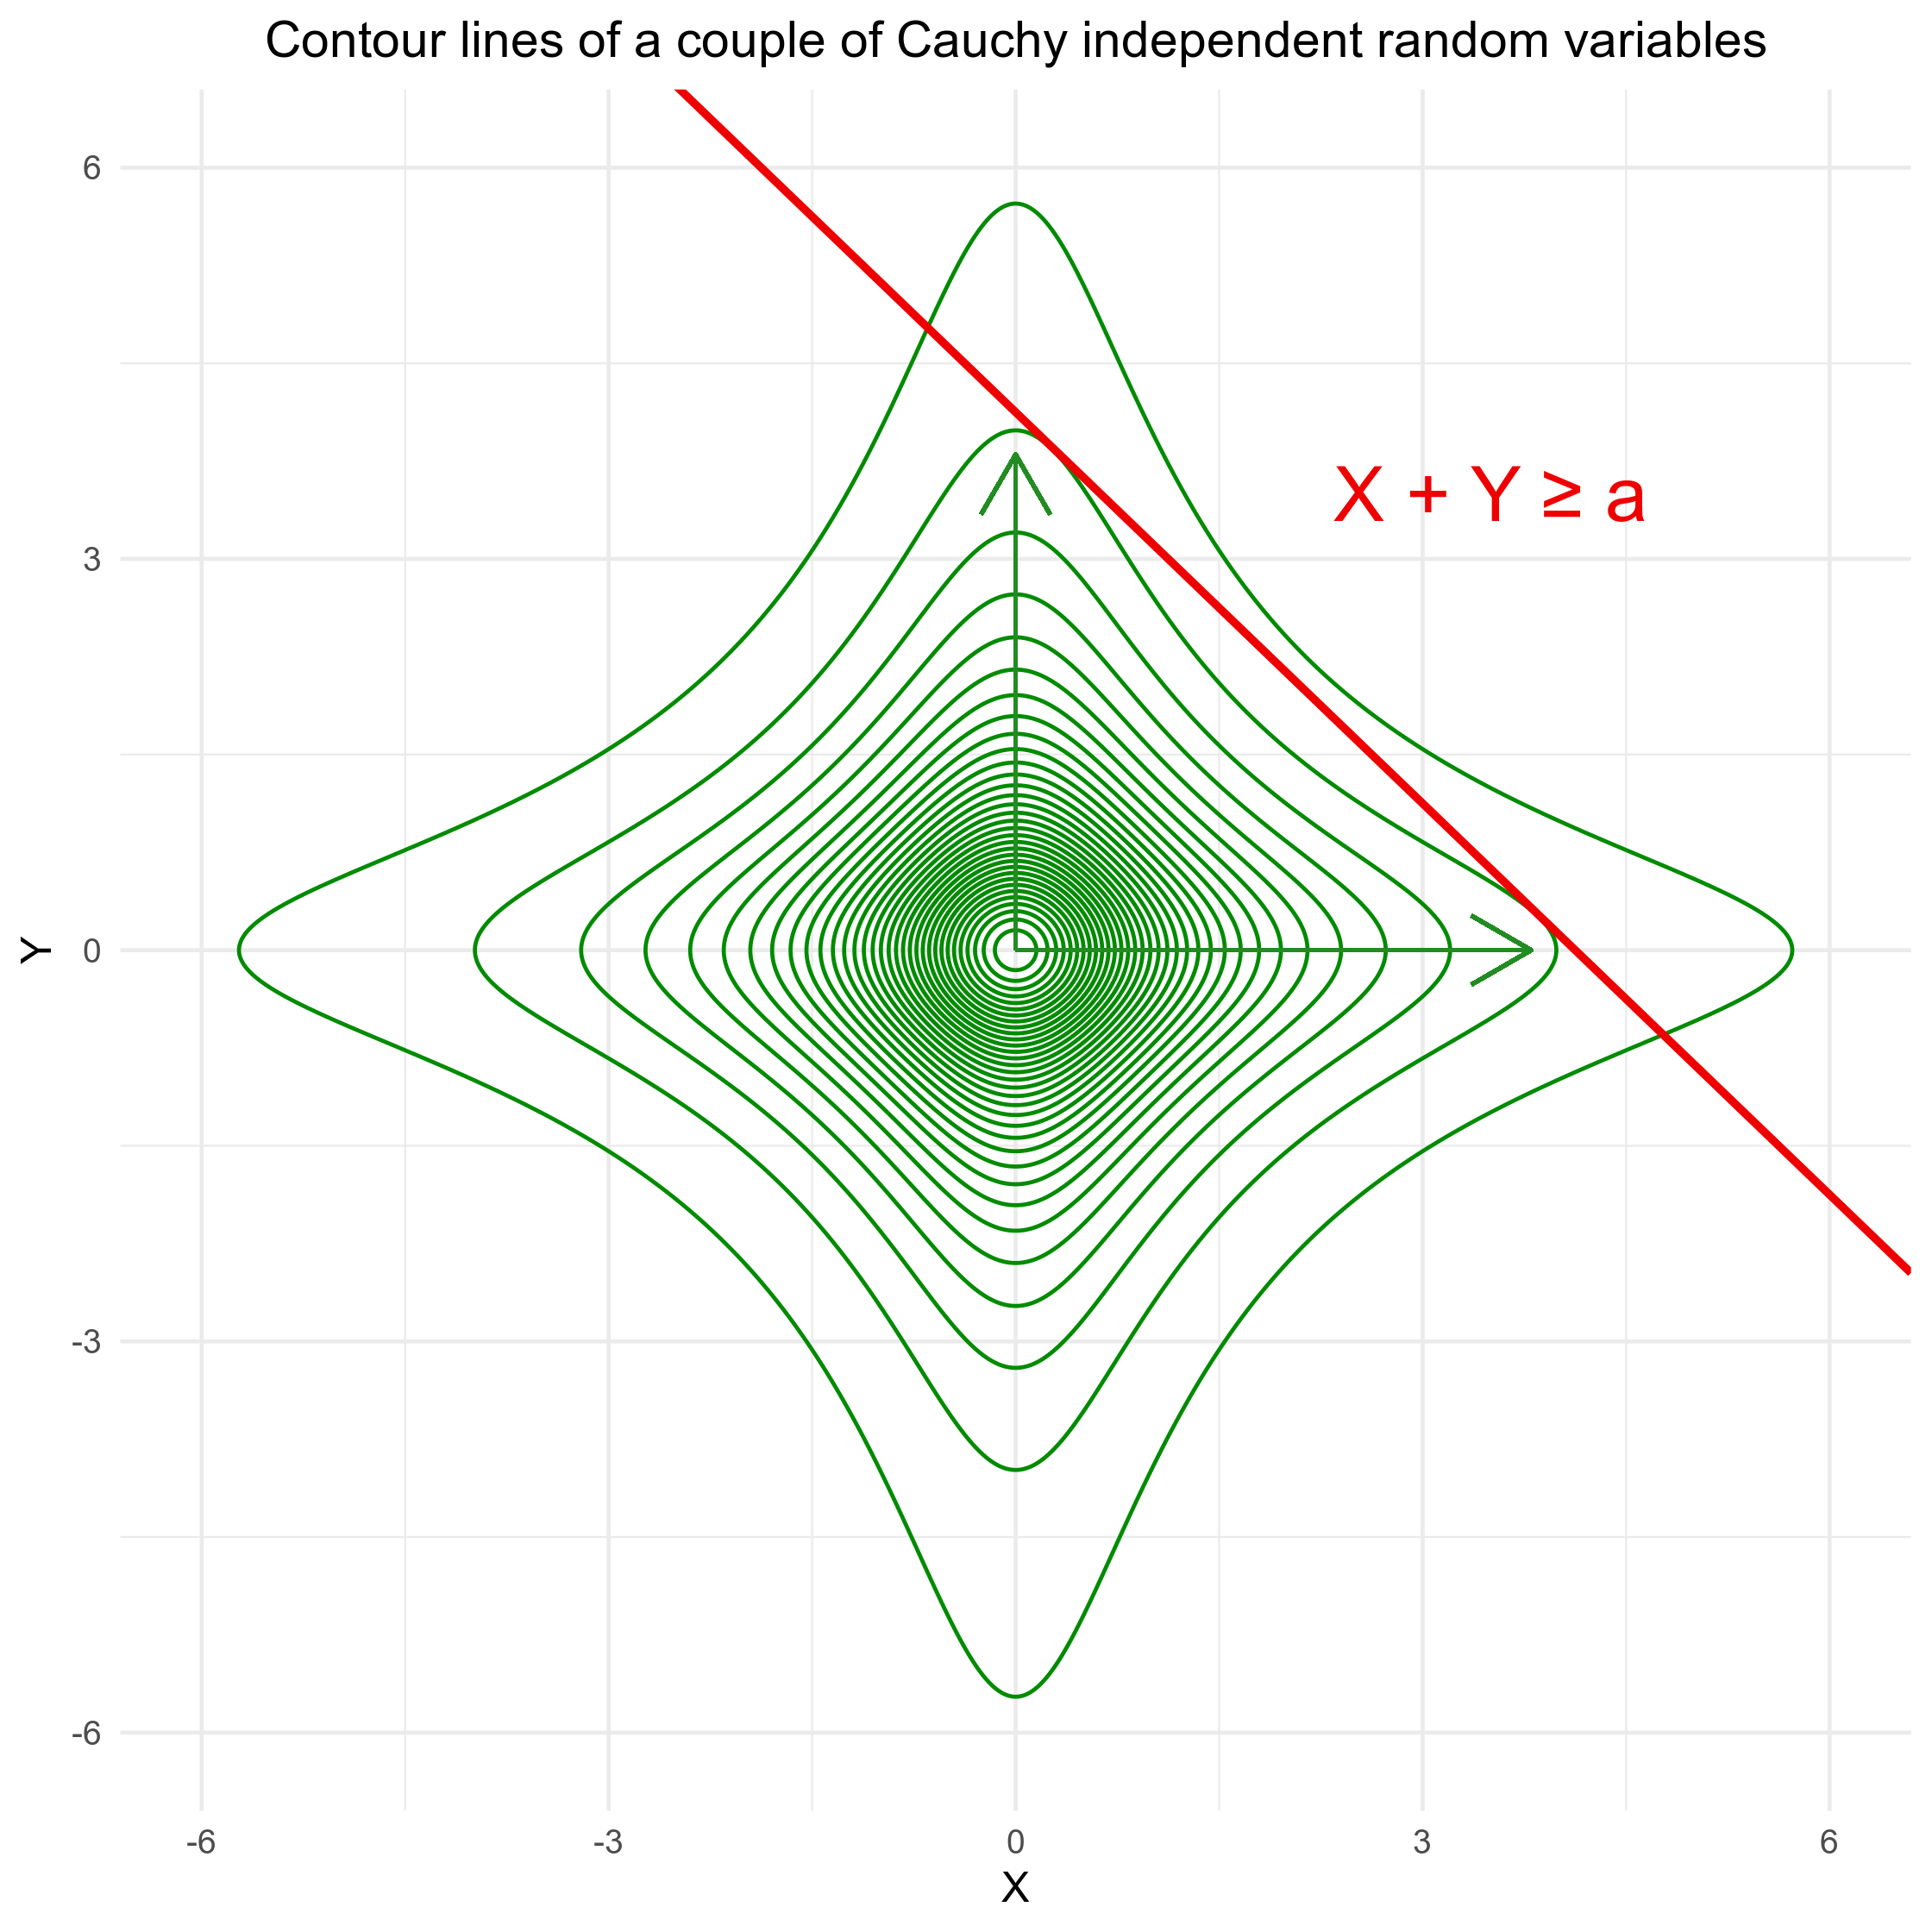
in this case, we can see that there are two points belonging to the domain
$ \{ x + y \geq a \ | \ (x, y) \in \mathbb{R} \} $ such that the probability density is highest: one close to the X-axis and one close to the Y-axis. Put differently, if $X + Y$ is large, then most likely either $X$ is large and $Y$ small, or vice versa.